The services that can be performed through our unit cover: extraction, genotyping, transcriptome analysis, NGS sequencing and bioinformatics and statistical analysis of your data. We are CSPro for sequencing with Illumina equipment and for Agilent SureSelect captures.
Extractions

Jellyfish of DNA in suspension © F.Viala/CNRS Photothèque
Genotyping, expression and kinome

Illumina chips for genotyping or expression studies.

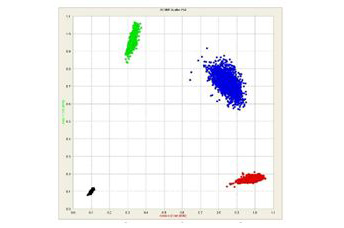
SNP genotyping scatter plot : genotype distribution as clusters after analysis
NGS Sequencing
Libraries preparation for CoDE-seq, WES, WGS, RNA seq, ChIP seq :

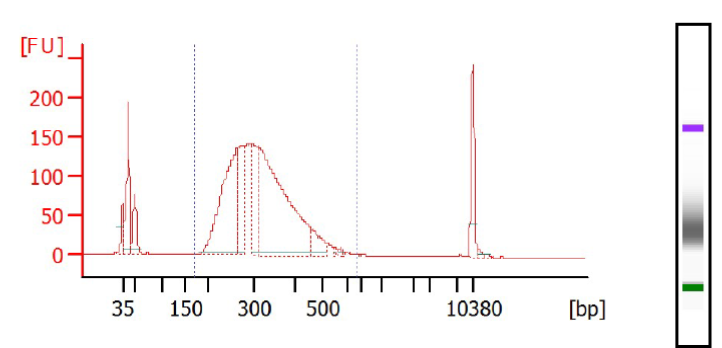
Profiles of Whole Exome (KAPA HyperCap With HyperExome Probes) obtained via Bioanalyzer, DNA High Sens chip – These libraries were fragmented and prepared via Sciclone® G3 NGSx iQ ™ Workstation (PerkinElmer®). They are ready for targeted sequencing via our Illumina sequencers (NovaSeq 6000Dx or NextSeq).
Next Generation Sequencing (NGS) using Illumina NovaSeq6000Dx, NextSeq500, MiSeq and iSeq100
We acquired the NovaSeq 6000Dx in December 2022 and the NovaSeq X+ in May 2023, the first equipment of these types installed in France, just like our NovaSeq 6000 back in June 2017! We also have a NextSeq 500 and a MiSeq.
These systems allow us to offer you three sequencing modes: ultra-high, high and medium.
We are certified for sequencing on Illumina NGS systems.

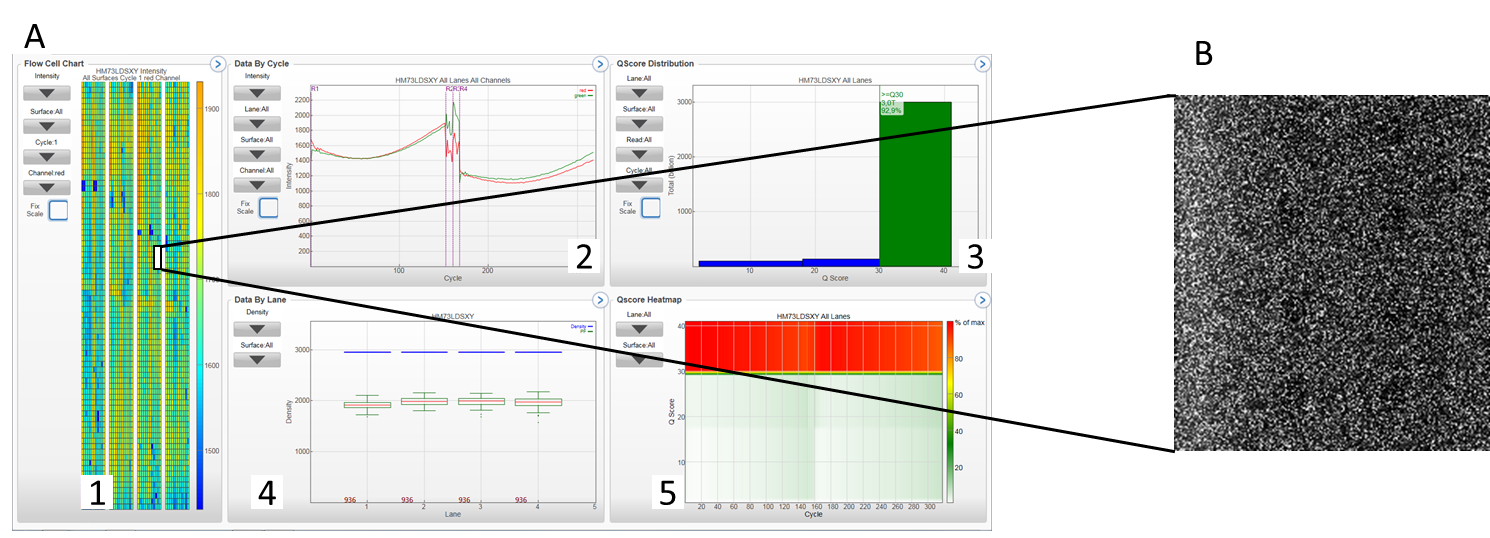
The Sequencing Analysis Viewer tool (Illumina) allows the visualization of the sequencing quality parameters during a run or at the end of a run on our sequencers NovaSeq 6000Dx, NextSeq or MiSeq.
A 1: flow cell chart displays color-coded quality metrics per tile for the entire flow cell (4 lanes of a NovaSeq S4 run); 2: Cycle plot displays plots that allows to follow the progression of quality metrics during a run, each base is color-coded; 3: QScore distribution: allows to visualize the number of reads by quality score. The quality score is cumulative for current cycle and previous cycles and only reads that pass the quality filter are included; 4: data per lane (numbdf of clusters/mm²) ; 5: QScore Heatmap : displays plots that allows to view the QScore by cycle. B Imaging tab: displays in detail a section of a flow cell. Various quality parameters can be analyzed (density of clusters pass clusters, error rate (determined by alignment with PhiX)…).

Overview of a sequencing run on NovaSeq 6000Dx / Image of a section of a S4 flow cell from NovaSeq6000Dx.
Bioinformatics and biostatistics analyzes
Bioinformatics analysis of high-throughput sequencing data :
Whole exome / Whole genome :
We offer different levels of analysis :

Sequence alignment from high throughput sequencers after use of Integrative Genomics Viewer tool.