Services

We are able to deliver you extracted samples, high throughput genotyping data, high throughput sequencing data, biostatistics and NGS bioinformatics analyses. We are Illumina Service Provider (CSPro) for sequencing on NGS equipments.

Extractions

  • DNA extractions from whole blood
    • via Machery Nagel Kit for small volumes of blood (1 – 4 mL)
    • on Qiagen Autopure LS : for big volumes :  5-10mL ; 10-20mL
  • DNA extractions from saliva / Oragen Kit
  • DNA extractions from tissues : FFPE or dry pellets


  • RNA extractions from tissues or dry pellets via Mechery Nagel kit

Jellyfish of DNA in suspension © F.Viala/CNRS Photothèque

Genotyping, expression and kinome

  • GWAS : High throughput genotyping via IScan Illumina
  • Methylation analyses via EPIC Beadchips
  • Expression analyses via NanoString technology
  • Pamstation 12 (Pamgene) : Kinome analyses (protein tyrosine kinases (PTK) or serine-threonine kinases (STK)) via Pamgene technology

Illumina chips for genotyping or expression studies.
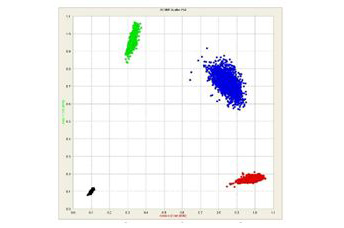
SNP genotyping scatter plot : genotype distribution as clusters after analysis

NGS Sequencing

Libraries preparation for High throughput sequencing:
  • CoDE-Seq : WES analysis CNV enriched – platform exclusivity
  • WES via : KAPA (HyperExome Roche) for exome sequencing
  • WES via : Twist Human Core Exome kit
  • WGS via : PCR free kits for genome sequencing
  • Targeted sequencing : capture on demand, custom or ready to load
  • RNA-seq: stranded mRNA-seq and total RNA-seq, depending on the project
  • ChiP-seq : via NEXTFLEX ChipSeq kits (without ChIP step)
  • ddRAD-seq : ready to load only
  • HiC : via Arima Genomics kits
  • Other kinds of libraries on demand


  • Automated library preparations : via STARlet (Hamilton) & Bravo (Agilent)
  • Quality control according to the provider’s protocols  via Bioanalyzer (Agilent) or LabChip (Perkin-Elmer)

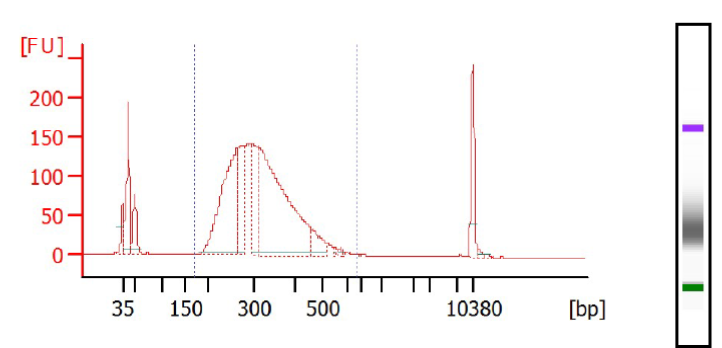
Profiles of Whole Exome (KAPA HyperCap With HyperExome Probes) obtained via Bioanalyzer, DNA High Sens chip – These libraries were fragmented and prepared via Sciclone® G3 NGSx iQ ™ Workstation (PerkinElmer®). They are ready for targeted sequencing via our Illumina sequencers (NovaSeq or NextSeq).

Next Generation Sequencing (NGS) using Illumina NovaSeq6000, NextSeq500, MiSeq

We acquired the NovaSeq in June 2017, the first equipment of this type installed in France at the time! The NextSeq500 was acquired in the first half of 2015. The MiSeq dates from the end of 2013.

These equipments allow us to offer you three sequencing modes: the ultra high, the high and the medium throughput sequencing modes. Whatever the method chosen, any types of libraries are susceptible to be sequenced on the HiSeq: Exomes, small RNA, total RNA, mRNA, MethylSeq, ChipSeq, amplicons, genomes, RAD…

We are certified for sequencing on Illumina NGS equipments.

illumina-propel


The Sequencing Analysis Viewer tool (Illumina) allows the visualization of the sequencing quality parameters during a run or at the end of a run on our sequencers NovaSeq, NextSeq or MiSeq.


A 1: flow cell chart displays color-coded quality metrics per tile for the entire flow cell (4 lanes of a NovaSeq S4 run); 2: Cycle plot displays plots that allows to follow the progression of quality metrics during a run, each base is color-coded; 3: QScore distribution: allows to visualize the number of reads by quality score. The quality score is cumulative for current cycle and previous cycles and only reads that pass the quality filter are included; 4: data per lane (numbdf of clusters/mm²) ; 5: QScore Heatmap : displays plots that allows to view the QScore by cycle. B Imaging tab: displays in detail a section of a flow cell. Various quality parameters can be analyzed (density of clusters pass clusters, error rate (determined by alignment with PhiX)…).
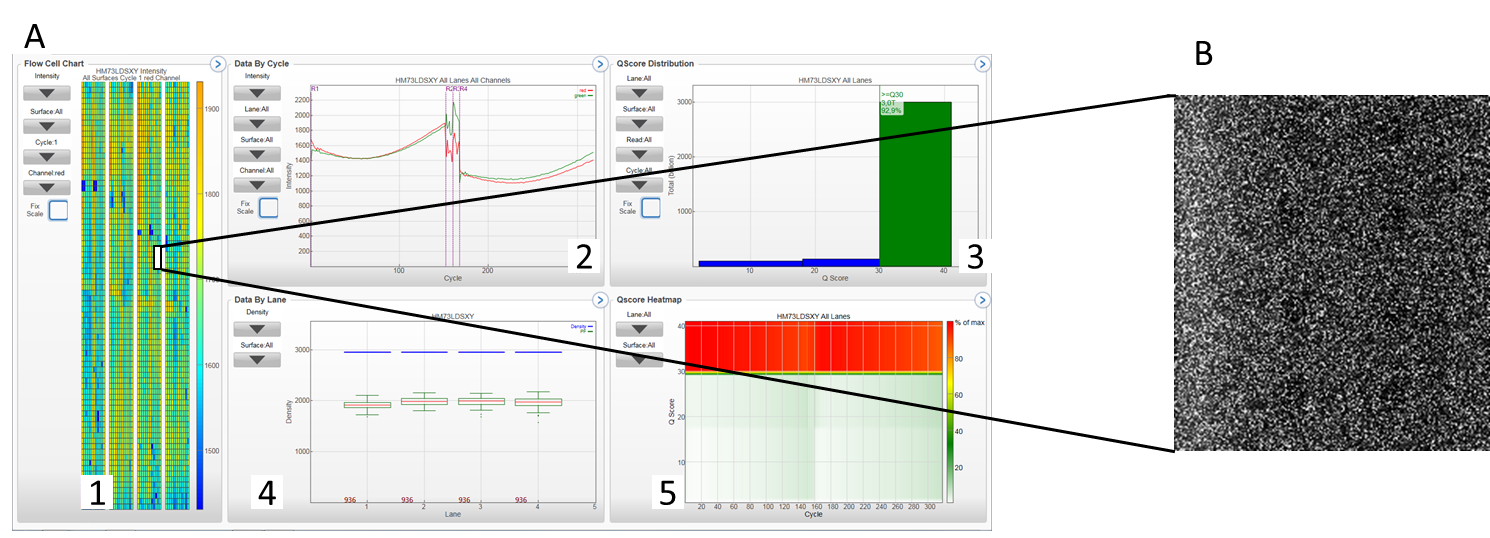
 

Overview of a sequencing run on NovaSeq / Image of a section of a flow cell

Bioinformatic and bio-statistics analyzes

  • Bioinformatics analysis of high-throughput sequencing data :
    Whole exome / Whole genome :
    We offer different levels of analysis :

    • Level 1: Data FastQ and reporting.
    • Level 2: Data FastQ, List of SNPs and Indels aligned with hg38 reference and with a depth filter of 8X, BAM/CRAM file, statistical reporting.
    • Level 3:
      • FastQ and BAM/CRAM Files,
      • List of the SNPs and Indels aligned with hg38 reference (filtered at 8X) with additional notes: gene, consequence (missense, stop lost, etc…), id swissprot, amino acid change, description of the gene, dbSNP hg19 (rs), hg19 coordinates, Complete Genomics frequencies, 1000 Genomes frequencies, GnomAD frequencies, functional predictions for non-synonyms coding SNPs, MIM disease, pathway, expression, interactions,
      • Statistics, report
    • Level 4: ON REQUEST (ex: comparative study between individuals, compared with genotyping data, segregation studies …).


  • Bio-statistical analyses:
    We offer you different analyzes that can be chosen independently each other :
    • RNA seq data:
      • 1: Analysis of differential expression (normalization and comparison of two or more conditions) + results annotation.
      • 2: Identification of (alternative) splicing sites.
    • SNP array data:
      • 1: Genome-wide association study, results annotation (gene + literature).
      • 2: Imputation of genotypes from a reference panel.
      • 3: Study enrichment of association signal in a set of genes (metabolic pathway, candidate genes, list of differentially expressed genes, etc.).
      • 4: Detection of chromosomal alterations (duplication, deletion and homozygosity mosaics regions, etc.).
    • NanoString data:
      • 1: Data quality control (raw, standardized data and reporting).
      • 2: Differential expression analysis.


Sequence alignment from high throughput sequencers after use of Integrative Genomics Viewer tool